Quick Answer
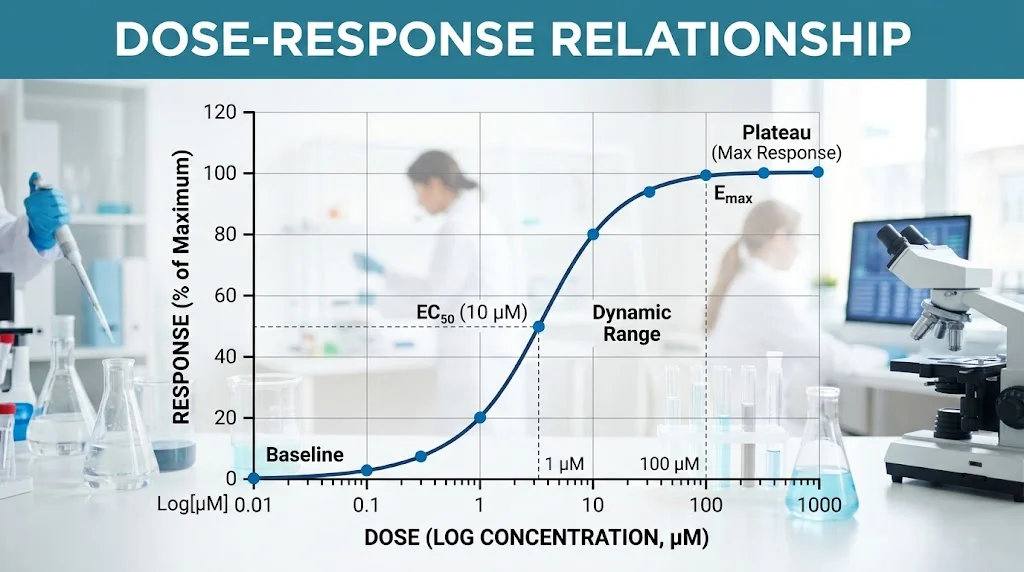
A dose response relationship describes how a change in the amount or intensity of an exposure is associated with a change in its effect. It is commonly discussed in medicine, pharmacology, toxicology, biology, and research.
Top alternatives: dose effect relationship, dose response curve, exposure response relationship, drug response relationship, dose effect pattern
Some scientific phrases sound intimidating until someone explains them like a normal human. Dose response relationship is one of those phrases. You may see it in biology, medicine, pharmacology, toxicology, research papers, or classroom notes, and at first glance it can feel much more complicated than it really is. At its basic level, the concept asks a straightforward question: what happens to an effect when the amount of an exposure changes?
Sometimes a larger amount produces a larger effect, but that pattern is not always perfectly linear. Effects can level off, appear after a threshold, or change in more complicated ways. Understanding this idea helps make graphs, experiments, drug studies, and scientific discussions much easier to follow. Whether you need a simple definition, a study-friendly explanation, or an easy example, the responses below break the concept into clear and memorable pieces.
Simple And Easy Responses
- “It shows how an effect changes when the amount changes.”
Example: Use this when explaining the concept to someone encountering it for the first time.
Meaning: It gives the simplest general explanation of the concept. - “More exposure can produce a different effect.”
Example: Use this when introducing the basic idea in a science discussion.
Meaning: It connects the amount of exposure with the observed outcome. - “Think of it as amount versus effect.”
Example: Use this when someone wants a quick way to remember the concept.
Meaning: It reduces the idea to its two central variables. - “It asks what happens when the dose changes.”
Example: Use this when explaining the term during a study session.
Meaning: It focuses on the question behind the relationship. - “The dose changes, and researchers watch the response.”
Example: Use this when describing an experiment in simple language.
Meaning: It explains the basic process of observing effects at different exposure levels. - “It connects exposure with outcome.”
Example: Use this when giving a short classroom definition.
Meaning: It describes the relationship between an amount and an observed effect. - “A dose response graph makes the pattern easier to see.”
Example: Use this when explaining why researchers use graphs.
Meaning: Visual data can show how effects vary across exposure levels. - “It is basically a question of how much causes how much effect.”
Example: Use this when explaining the concept casually.
Meaning: It turns the technical phrase into an everyday question. - “Researchers compare different amounts with their observed effects.”
Example: Use this when discussing experimental data.
Meaning: It describes a common way of studying exposure and response. - “The relationship can be increasing, decreasing, or more complicated.”
Example: Use this when someone assumes every relationship is a straight line.
Meaning: It points out that response patterns can differ. - “The pattern tells researchers how response changes across exposure levels.”
Example: Use this when summarizing research findings.
Meaning: It focuses on changes across the range of doses studied. - “It is about the relationship, not just one dose.”
Example: Use this when someone focuses on a single measurement.
Meaning: The concept usually considers how responses vary across multiple levels. - “The curve tells part of the scientific story.”
Example: Use this when looking at a dose response graph.
Meaning: The shape of the curve can provide useful information about the observed relationship. - “It helps researchers describe how effects vary with exposure.”
Example: Use this in a basic science explanation.
Meaning: It summarizes the practical purpose of studying the relationship. - “In simple terms, it is amount compared with effect.”
Example: Use this as a quick study note.
Meaning: It provides a concise memory aid.
Funny Responses
- “Science asking, ‘Okay, but what happens if we change the amount?’”
Example: Use this when making a complicated lecture sound more relatable.
Meaning: It humorously summarizes the central research question. - “Same experiment, different amount, suddenly we have a graph.”
Example: Use this when joking about how scientific data are presented.
Meaning: It describes how changing exposure levels can produce a visual pattern. - “The dose changes and the data start talking.”
Example: Use this when introducing experimental results.
Meaning: It humorously describes researchers observing different responses. - “Basically, science loves an amount-versus-effect chart.”
Example: Use this when explaining why dose response graphs appear in research.
Meaning: It makes the technical concept feel less intimidating. - “Tiny change, big graph energy.”
Example: Use this when discussing different exposure levels.
Meaning: It playfully emphasizes that small changes can produce measurable differences. - “The curve has entered the chat.”
Example: Use this when introducing a graph in class.
Meaning: It gives a dose response curve a humorous personality. - “One dose was not enough for science, apparently.”
Example: Use this when explaining why researchers compare several levels.
Meaning: It jokes about the need to examine a range of exposures. - “Science said, ‘Let’s see what happens next.’”
Example: Use this when describing changing exposure levels.
Meaning: It humorously captures the investigative nature of experiments. - “Welcome to the amount-versus-effect saga.”
Example: Use this when starting a study session.
Meaning: It turns the topic into a playful storyline. - “The graph is basically telling us the relationship gossip.”
Example: Use this when reading a curve.
Meaning: It humorously suggests that the graph reveals useful information. - “More data, more questions, classic science.”
Example: Use this when discussing research results.
Meaning: It highlights how scientific investigation often leads to further questions. - “The curve refuses to keep things simple.”
Example: Use this when the relationship is not linear.
Meaning: It jokes about complicated response patterns. - “Science brought receipts in graph form.”
Example: Use this when presenting experimental results.
Meaning: It humorously refers to data as evidence. - “The dose changed and suddenly everyone needs statistics.”
Example: Use this when moving from a simple concept into data analysis.
Meaning: It jokes about the quantitative side of research. - “Nothing says biology like a mysterious-looking curve.”
Example: Use this when studying a graph that initially looks confusing.
Meaning: It makes the visual complexity feel more approachable.
Professional Responses
- “The relationship describes how an observed response varies across exposure levels.”
Example: Use this in a formal academic explanation.
Meaning: It provides a precise description without oversimplifying the concept. - “Researchers evaluate response patterns across a range of doses.”
Example: Use this when summarizing an experimental design.
Meaning: It explains how different exposure levels can be compared. - “The response may vary according to the magnitude of exposure.”
Example: Use this in a scientific report.
Meaning: It states that exposure level can be associated with changes in effect. - “A dose response analysis can help characterize observed effects.”
Example: Use this when discussing research methods.
Meaning: It describes one purpose of examining exposure and response data. - “The shape of the response curve can provide useful information.”
Example: Use this when discussing graph interpretation.
Meaning: It highlights the informational value of the curve’s pattern. - “The observed relationship should be interpreted within the study context.”
Example: Use this when presenting research findings.
Meaning: It emphasizes that results depend on experimental conditions and population. - “Different exposure levels may produce different response patterns.”
Example: Use this when describing variable results.
Meaning: It acknowledges that relationships are not always identical. - “Researchers may evaluate both the magnitude and pattern of response.”
Example: Use this in a formal scientific discussion.
Meaning: It identifies two important aspects of interpreting data. - “A graphical analysis can illustrate changes across the tested range.”
Example: Use this when describing a dose response graph.
Meaning: It explains the value of visualizing the data. - “The relationship may be linear over one range and nonlinear over another.”
Example: Use this when explaining complex data.
Meaning: It acknowledges that patterns can change across exposure levels. - “Interpretation requires attention to the experimental design and measurements.”
Example: Use this in an academic report.
Meaning: It stresses the importance of research context. - “Response measurements should be evaluated alongside the exposure levels used.”
Example: Use this when reviewing experimental data.
Meaning: It connects outcomes to the conditions under which they were observed. - “The relationship is generally assessed using multiple exposure levels.”
Example: Use this when explaining study methodology.
Meaning: It describes how researchers can examine changes across a range. - “The observed pattern does not automatically establish causation.”
Example: Use this when interpreting observational data.
Meaning: It distinguishes an observed association from a causal conclusion. - “Careful interpretation helps prevent conclusions that exceed the available evidence.”
Example: Use this in a research discussion.
Meaning: It emphasizes responsible interpretation of scientific findings.
Clever Responses
- “Amount on one side, response on the other.”
Example: Use this as a quick memory trick before an exam.
Meaning: It reduces the concept to its main variables. - “Change the exposure, then observe the pattern.”
Example: Use this when explaining the logic of an experiment.
Meaning: It captures the basic approach to studying the relationship. - “Do not confuse a curve with a conclusion.”
Example: Use this when interpreting a graph.
Meaning: A graph shows a pattern but still requires scientific context. - “The slope tells you how quickly the response changes in that region.”
Example: Use this when studying graph features.
Meaning: It explains what changes in steepness can communicate. - “A relationship can be real without being perfectly straight.”
Example: Use this when someone expects a linear pattern.
Meaning: It explains that scientific relationships can be nonlinear. - “The range matters as much as the curve.”
Example: Use this when comparing two dose response graphs.
Meaning: Interpretation depends partly on which exposure levels were studied. - “Look for the pattern before naming the mechanism.”
Example: Use this when discussing experimental data.
Meaning: It encourages separating observation from explanation. - “A response curve is evidence to interpret, not a shortcut around interpretation.”
Example: Use this in a research discussion.
Meaning: Graphs still require careful scientific analysis. - “Same outcome does not always mean same relationship.”
Example: Use this when comparing studies.
Meaning: Similar outcomes can arise under different exposure response patterns. - “The important question is how the response changes across the range.”
Example: Use this when someone focuses only on the highest dose.
Meaning: It emphasizes the entire relationship. - “Thresholds and plateaus can change the story.”
Example: Use this when explaining nonlinear curves.
Meaning: These features can alter how the relationship is interpreted. - “Data points become more useful when you see their pattern.”
Example: Use this when introducing graphs.
Meaning: A collection of measurements can reveal trends not obvious from individual values. - “Correlation is not automatically causation.”
Example: Use this when discussing observational research.
Meaning: It reminds readers not to overinterpret an association. - “A curve can answer one question while raising another.”
Example: Use this when research results reveal an unexpected pattern.
Meaning: Scientific findings can generate further questions. - “Good interpretation starts with what was actually measured.”
Example: Use this when reviewing a scientific claim.
Meaning: It encourages attention to the evidence itself.
Study-Friendly Responses
- “Remember it as dose versus response.”
Example: Use this as a short exam revision note.
Meaning: It gives the simplest memory shortcut. - “Higher exposure does not automatically mean a proportionally higher response.”
Example: Use this when reviewing nonlinear relationships.
Meaning: The size of the response may not increase at a constant rate. - “The graph helps you see how the response changes.”
Example: Use this when learning to interpret a curve.
Meaning: Visualization can make the relationship easier to understand. - “Start by identifying the exposure variable.”
Example: Use this when beginning a graph question.
Meaning: Knowing what is being changed helps organize the interpretation. - “Then identify what response is being measured.”
Example: Use this when studying experimental data.
Meaning: It clarifies the outcome being examined. - “Next, look at how the response changes across the range.”
Example: Use this when analyzing a curve.
Meaning: It directs attention to the pattern rather than one point. - “A straight line is only one possible pattern.”
Example: Use this when reviewing graph types.
Meaning: It reminds students that dose response relationships can take different forms. - “A plateau means the response is no longer increasing in the same way.”
Example: Use this when studying a curve with a flat region.
Meaning: It explains the basic idea behind a plateau. - “A steep section means the response changes rapidly across that region.”
Example: Use this when interpreting a graph.
Meaning: It connects slope with the rate of response change. - “A threshold refers to a point or range where a measurable response begins under a specified model or context.”
Example: Use this when reviewing threshold concepts.
Meaning: It explains the idea without treating every threshold as universal. - “Always check the units before interpreting a graph.”
Example: Use this when studying scientific figures.
Meaning: Units help clarify what the exposure and response measurements represent. - “Look at the axes before reading the curve.”
Example: Use this during exam preparation.
Meaning: Understanding the variables prevents incorrect interpretation. - “Do not assume every curve means the same thing.”
Example: Use this when comparing graphs from different studies.
Meaning: Context affects interpretation. - “Study the whole pattern instead of memorizing one picture.”
Example: Use this when preparing for a science exam.
Meaning: Understanding the concept is more useful than memorizing one graph. - “Ask what changed, what was measured, and what pattern appeared.”
Example: Use this as a three-step study method.
Meaning: These questions help organize basic interpretation.
Graph And Curve Responses
- “The x-axis commonly represents the dose or exposure level.”
Example: Use this when explaining the basic layout of a graph.
Meaning: The horizontal axis often shows the amount of exposure being examined. - “The y-axis commonly represents the measured response.”
Example: Use this when teaching someone to read the graph.
Meaning: The vertical axis often displays the observed effect. - “A rising curve means the measured response increases across that range.”
Example: Use this when describing an upward-trending graph.
Meaning: It explains the basic visual pattern. - “A flat section suggests little additional change in the measured response.”
Example: Use this when discussing a plateau.
Meaning: The response is relatively stable across that section. - “A steep curve indicates a rapid change in response over a relatively small exposure range.”
Example: Use this when analyzing slope.
Meaning: It explains why steepness matters. - “A shallow curve indicates a slower change in response across that region.”
Example: Use this when comparing two sections of a graph.
Meaning: It describes a more gradual change. - “A curve can reveal patterns that individual data points hide.”
Example: Use this when explaining why researchers visualize data.
Meaning: Graphs can make overall trends easier to identify. - “The shape of the curve should be interpreted with the study design.”
Example: Use this when discussing research findings.
Meaning: Graph shape alone does not provide the complete scientific context. - “A nonlinear curve means the response does not change at a constant rate.”
Example: Use this when explaining nonlinear relationships.
Meaning: It defines the central feature of nonlinearity. - “Different models can describe different response patterns.”
Example: Use this when discussing statistical analysis.
Meaning: Researchers may use mathematical approaches suited to the data. - “A graph can show where changes are larger or smaller.”
Example: Use this when comparing different exposure regions.
Meaning: Visual patterns can highlight changes in response. - “The curve is a visual summary of measured observations.”
Example: Use this when explaining graphs to beginners.
Meaning: It describes what the graph represents. - “Do not read beyond the range that was actually studied.”
Example: Use this when interpreting an experimental curve.
Meaning: Extrapolating beyond available data can be inappropriate. - “The axis labels are part of the evidence.”
Example: Use this when someone interprets a graph too quickly.
Meaning: Labels provide essential context. - “The graph becomes useful when you connect its shape to the measured variables.”
Example: Use this when teaching scientific graph interpretation.
Meaning: Understanding the variables makes the visual pattern meaningful.
Research Responses
- “Researchers use these relationships to examine how outcomes vary with exposure.”
Example: Use this when explaining why dose response studies are performed.
Meaning: It describes a broad research purpose. - “The study population can affect how the findings should be interpreted.”
Example: Use this when comparing research involving different groups.
Meaning: Findings from one population may not directly apply to another. - “Study design matters when interpreting a response pattern.”
Example: Use this when reviewing research results.
Meaning: Methodology affects what conclusions can reasonably be drawn. - “Researchers need reliable measurements to characterize the relationship.”
Example: Use this when discussing data quality.
Meaning: Measurement quality influences the usefulness of the findings. - “The tested exposure range can influence the observed curve.”
Example: Use this when comparing different experiments.
Meaning: Different ranges may reveal different parts of a relationship. - “Replication can help determine whether a pattern is consistent.”
Example: Use this when discussing scientific reliability.
Meaning: Repeated research can provide additional evidence about reproducibility. - “Statistical analysis can help quantify patterns in the data.”
Example: Use this in a research methods discussion.
Meaning: Statistical tools can help describe relationships numerically. - “Researchers distinguish observed patterns from explanations of why they occur.”
Example: Use this when discussing scientific interpretation.
Meaning: An observed relationship does not automatically reveal its mechanism. - “A single experiment may not answer every question about the relationship.”
Example: Use this when discussing limitations.
Meaning: Research findings often have defined boundaries. - “Different studies may produce different curves under different conditions.”
Example: Use this when comparing research results.
Meaning: Experimental conditions can influence observed patterns. - “Measurement error can affect the apparent relationship.”
Example: Use this when discussing data limitations.
Meaning: Imperfect measurements can alter observed patterns. - “Researchers consider uncertainty when interpreting estimated relationships.”
Example: Use this when discussing statistical results.
Meaning: Scientific estimates are often accompanied by uncertainty. - “The biological or chemical system being studied also matters.”
Example: Use this when comparing studies involving different systems.
Meaning: Different systems can respond differently to exposure. - “A research finding should be interpreted within its original context.”
Example: Use this when summarizing published results.
Meaning: Context helps prevent inappropriate generalization. - “The relationship provides evidence about patterns, while further research may explore mechanisms.”
Example: Use this when explaining what a study can and cannot establish.
Meaning: Observing a response pattern and explaining its cause are distinct research tasks.
Biology And Pharmacology Responses
- “In pharmacology, researchers often examine how response changes with drug exposure.”
Example: Use this when introducing the concept in a pharmacology class.
Meaning: Drug response is one important application of dose response analysis. - “Different amounts of an active substance can be associated with different measured effects.”
Example: Use this when explaining pharmacological experiments.
Meaning: It connects exposure levels with observed outcomes. - “Researchers may use response curves to characterize drug effects.”
Example: Use this when discussing pharmacology research.
Meaning: Curves can summarize how measured responses vary across exposure levels. - “The maximum observed response is often discussed when analyzing a response curve.”
Example: Use this when learning pharmacology terminology.
Meaning: Researchers may examine the greatest response observed within the study conditions. - “Potency and maximum response describe different features of a response relationship.”
Example: Use this when reviewing pharmacology concepts.
Meaning: These terms should not be treated as interchangeable. - “A shift in a curve can represent a change in the relationship under study.”
Example: Use this when comparing experimental conditions.
Meaning: Curve position can provide information about differences between conditions. - “The exact interpretation depends on what was measured and how the experiment was designed.”
Example: Use this when explaining pharmacological graphs.
Meaning: The graph cannot be interpreted independently of its methodology. - “Biological responses can involve thresholds, plateaus, and nonlinear patterns.”
Example: Use this when explaining why curves are not always straight.
Meaning: Biological systems can produce complex response patterns. - “A response curve does not describe every biological process in the same way.”
Example: Use this when comparing different experiments.
Meaning: Different biological systems can produce different patterns. - “Researchers may compare response curves between experimental conditions.”
Example: Use this when discussing controlled experiments.
Meaning: Comparing curves can reveal differences in observed responses. - “A measured response can be behavioral, physiological, biochemical, or another defined outcome.”
Example: Use this when explaining the variety of research applications.
Meaning: Response is defined by what the study measures. - “Exposure and response need clear definitions before a graph can be interpreted.”
Example: Use this when teaching beginners.
Meaning: Knowing the variables is essential for understanding the graph. - “Pharmacological interpretation requires attention to the specific substance and experimental conditions.”
Example: Use this in an academic discussion.
Meaning: Different substances and conditions can produce different patterns. - “A response relationship describes observed data rather than guaranteeing the same pattern everywhere.”
Example: Use this when discussing generalization.
Meaning: Findings should not automatically be extended beyond their evidence. - “The most useful interpretation connects the curve with the underlying study question.”
Example: Use this when analyzing a pharmacology graph.
Meaning: The purpose of the experiment helps determine what the curve means.
Toxicology And Safety Responses
- “Toxicology often examines how harmful effects vary with exposure.”
Example: Use this when introducing the concept in a toxicology class.
Meaning: Toxicology uses exposure response relationships to study adverse outcomes. - “The relationship can help researchers characterize observed adverse effects.”
Example: Use this when discussing toxicological research.
Meaning: It describes one scientific use of exposure response analysis. - “Higher exposure does not automatically produce a perfectly proportional change.”
Example: Use this when explaining nonlinear toxicological data.
Meaning: The response may change at different rates across the exposure range. - “Researchers consider the exposure range when interpreting toxicological findings.”
Example: Use this when reviewing a safety study.
Meaning: The studied range affects what the data can show. - “Different endpoints can produce different response relationships.”
Example: Use this when comparing toxicology measurements.
Meaning: Different measured outcomes may behave differently. - “A threshold concept depends on the specific substance, endpoint, model, and evidence.”
Example: Use this when discussing threshold interpretations.
Meaning: Threshold claims require context rather than a universal assumption. - “Toxicological graphs should be interpreted using the study’s defined measurements.”
Example: Use this when reviewing a scientific figure.
Meaning: The endpoint determines what the response represents. - “Exposure and response should be considered together.”
Example: Use this when summarizing a safety study.
Meaning: An effect needs to be understood in relation to the exposure conditions. - “Animal, laboratory, and human findings may not be directly interchangeable.”
Example: Use this when discussing evidence from different study types.
Meaning: Different models have different limitations and contexts. - “A response pattern does not automatically establish a safe or unsafe level.”
Example: Use this when discussing regulatory interpretation.
Meaning: Safety conclusions require broader evidence and context. - “Researchers may examine both the size and frequency of observed effects.”
Example: Use this when discussing different response measurements.
Meaning: Multiple features of an outcome can be important. - “Uncertainty is an important part of interpreting exposure response data.”
Example: Use this when discussing scientific risk assessment.
Meaning: Data rarely provide unlimited certainty. - “The same exposure can produce different outcomes under different conditions.”
Example: Use this when comparing experimental settings.
Meaning: Context can influence observed responses. - “Scientific interpretation should stay within the evidence provided by the study.”
Example: Use this when summarizing research.
Meaning: It discourages unsupported generalization. - “Toxicological conclusions require more than simply looking at whether a curve rises.”
Example: Use this when teaching graph interpretation.
Meaning: A complete assessment requires additional information beyond curve direction.
Casual And Conversational Responses
- “It basically means watching what changes when the amount changes.”
Example: Use this when explaining the term to a friend.
Meaning: It gives a conversational definition. - “Think amount in, effect out.”
Example: Use this as an easy memory shortcut.
Meaning: It summarizes the basic input and output idea. - “Change the dose, watch the response.”
Example: Use this when explaining the concept quickly.
Meaning: It captures the basic experimental logic. - “It is just a fancy way to talk about amount and effect.”
Example: Use this when making the term less intimidating.
Meaning: It translates technical language into simpler wording. - “The graph shows how the effect moves as exposure changes.”
Example: Use this when discussing a chart.
Meaning: It describes what the visual relationship represents. - “Sometimes more means more, but not always in a straight line.”
Example: Use this when explaining nonlinear patterns.
Meaning: It reminds listeners that response changes can vary. - “It is basically science tracking what happens at different amounts.”
Example: Use this in an informal study conversation.
Meaning: It explains the concept in everyday language. - “The curve is showing the response story.”
Example: Use this when looking at a graph.
Meaning: It gives a simple interpretation of the curve. - “You change one thing and see how the other thing responds.”
Example: Use this when introducing the idea to a beginner.
Meaning: It describes the relationship in broad terms. - “It is a pattern, not a magic formula.”
Example: Use this when someone expects one universal rule.
Meaning: It emphasizes that interpretation depends on context. - “The important part is how the response changes across the range.”
Example: Use this when explaining why multiple measurements matter.
Meaning: It focuses on the overall pattern. - “Different curves can tell different stories.”
Example: Use this when comparing graphs.
Meaning: Curve shape depends on the relationship being studied. - “Do not panic when you see the graph.”
Example: Use this when helping someone study.
Meaning: It makes a technical graph feel less intimidating. - “Find the dose, find the response, then look at the pattern.”
Example: Use this as a simple graph-reading strategy.
Meaning: It provides an easy sequence for understanding the data. - “Once you understand the two variables, the phrase gets much easier.”
Example: Use this when helping someone remember the concept.
Meaning: It emphasizes understanding the basic components.
Smart And Academic Responses
- “The concept examines the functional relationship between an exposure level and a defined response.”
Example: Use this in an academic assignment.
Meaning: It provides a formal definition suitable for scientific writing. - “Response patterns may depend on the biological or experimental system being studied.”
Example: Use this when discussing research limitations.
Meaning: It acknowledges that context can affect results. - “The mathematical form of the relationship depends on the observed data and selected model.”
Example: Use this when discussing quantitative analysis.
Meaning: Different datasets may require different analytical approaches. - “A dose response curve provides a visual representation of the measured relationship.”
Example: Use this when defining the purpose of a graph.
Meaning: It explains what the curve represents. - “The observed response should be interpreted within the relevant exposure range.”
Example: Use this when analyzing research findings.
Meaning: It discourages conclusions beyond the studied range. - “Nonlinearity indicates that changes in exposure are not associated with a constant rate of response change.”
Example: Use this in a scientific explanation.
Meaning: It formally describes nonlinear behavior. - “A plateau indicates relative stabilization of the measured response across part of the exposure range.”
Example: Use this when describing a graph.
Meaning: It explains what a flat region can indicate. - “The relationship may differ between experimental conditions.”
Example: Use this when comparing study groups.
Meaning: Different conditions can produce different response patterns. - “Observed associations should not automatically be interpreted as causal relationships.”
Example: Use this when discussing observational evidence.
Meaning: Association alone does not establish causality. - “The reliability of the relationship depends partly on the quality of the underlying measurements.”
Example: Use this when evaluating data.
Meaning: Poor measurements can weaken interpretation. - “Model selection can influence how the relationship is quantitatively described.”
Example: Use this when discussing statistical modeling.
Meaning: Analytical choices affect how data are represented. - “A well-characterized relationship requires clearly defined exposure and response variables.”
Example: Use this when explaining research methodology.
Meaning: Precise variable definitions are essential. - “The interpretation of a curve should consider uncertainty and study limitations.”
Example: Use this when reviewing published research.
Meaning: Scientific conclusions need appropriate caution. - “The same visual pattern can have different interpretations in different experimental contexts.”
Example: Use this when comparing graphs.
Meaning: Context determines what a pattern represents. - “Understanding the relationship requires both quantitative data and appropriate scientific context.”
Example: Use this as a final academic summary.
Meaning: Numbers alone are not enough for complete interpretation.
FAQs
What Does Dose Response Relationship Mean?
It describes how a measured response changes as the amount or level of an exposure changes.
Why Is It Important?
It helps researchers understand patterns between exposure and observed effects across different levels.
Is A Higher Dose Always Linked To A Higher Response?
No. Some relationships are nonlinear, may level off, or may show more complicated patterns depending on the system and endpoint being studied.
What Is A Dose Response Curve?
It is a graph that visually represents the relationship between an exposure level and a measured response.
What Are The Two Main Variables?
The two basic components are the dose or exposure level and the measured response.
Conclusion
Understanding dose response relationship becomes much easier when you stop treating it like a complicated scientific phrase and remember the basic idea: compare an exposure level with the response that is measured. From classroom graphs to pharmacology and toxicology research, the concept helps researchers describe patterns across different levels of exposure. The important part is not assuming that every curve will look the same.
Some relationships can be linear, while others can include plateaus, thresholds, or more complex patterns. When studying a graph, start with the axes, identify the variables, examine the overall pattern, and then consider the research context. Save this guide for your next study session, share it with a classmate, and make those confusing science graphs a little easier to understand.
Discover More Related Articles:
- Emergency Response Jobs | Salary, Skills, Training & Opportunities In 2026
- Clear Blue vs First Response | Accuracy, Timing & Results In 2026

1 thought on “Dose Response Relationship | How Scientists Measure Drug Effects In 2026”